PODS, moving trucks, USPS updates and more
wisdom from Clusters class on measuring people flows post-pandemic
Happy November! We just had week 10 of Clusters class, with discussion of the Shenzhen cluster, including several fascinating moments of human agency (e.g. Deng Xiaoping’s Southern Tours) in Shenzhen’s history and formation.
Class this year is 46 students, rather last year’s 11 intrepid explorers who joined the 2021 launch version of class. In addition to MBAs, this year we also have graduate students from the School of Public Policy, and UC-Berkeley’s new Development Engineering program. Measuring people flows post-covid and how these past 2+ years have impacted the vector cities were already on is part of class. Over a sequence of assignments, students have identified a variety of metrics by which to measure post-pandemic population flows and economic activity. In this post, I’ll be sharing some highlights shared by members of class.
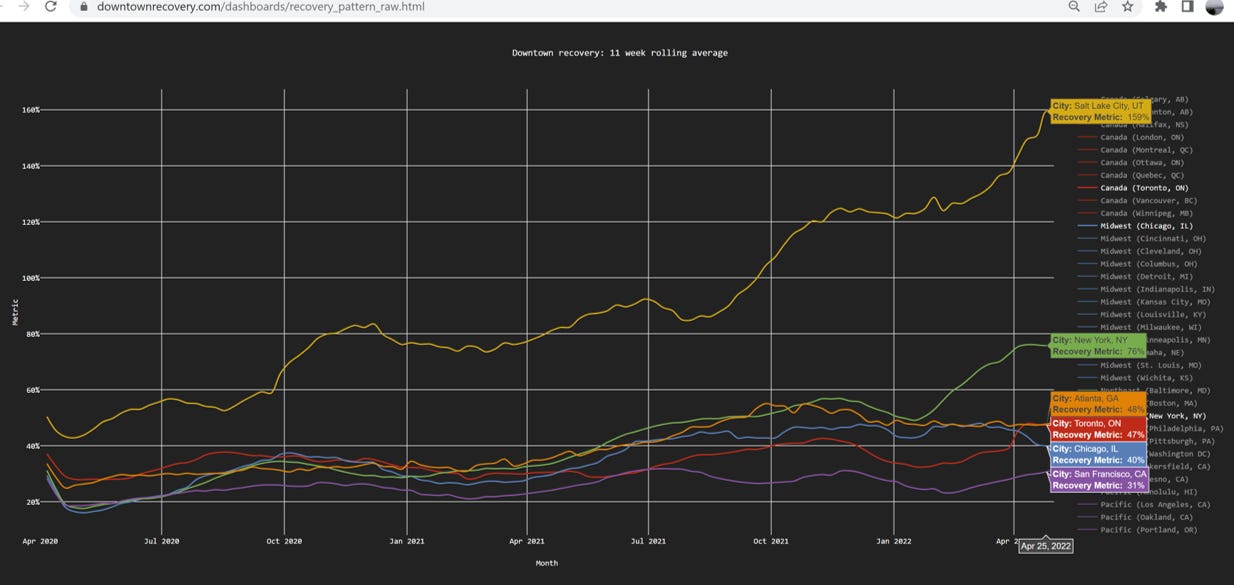
Downtown Recovery index -
This was shared by Daniel Huang, Development Engineering student (and class president). Daniel is himself involved in the project, led by Karen Chapple with the UCB College of Environmental Design. The team uses mobile handset data from SafeGraph to assess civic activity levels. The UI is akin to Google Mobility Index.
The big winner: Salt Lake City. The Silicon Slopes are thriving, apparently. The recovery laggard? San Francisco. (Note that data is from March to May 2022.)
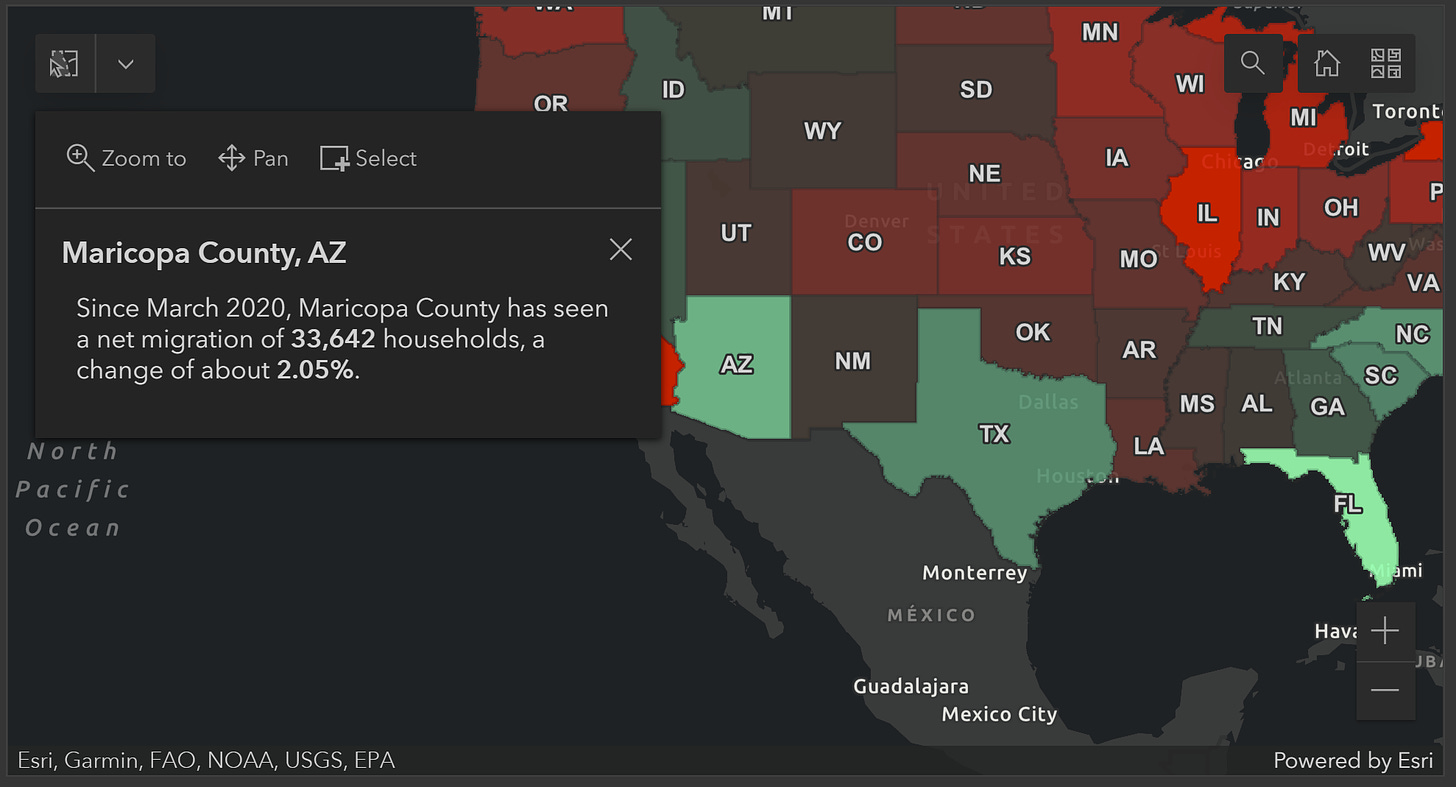
This was submitted by MBA Albert Alix to support a paper looking at growth in greater Phoenix. As it involves mailing addresses, this involves a count of households, not individuals, and also seems like a good measure of serious intent to linger for a while.
Note the visualization does not disclose how frequently the underlying data is updated. But nonetheless, as a way to quickly surface potential winners and proceed with further investigation (was this already an existing trend, and if so, why?) this was very useful.
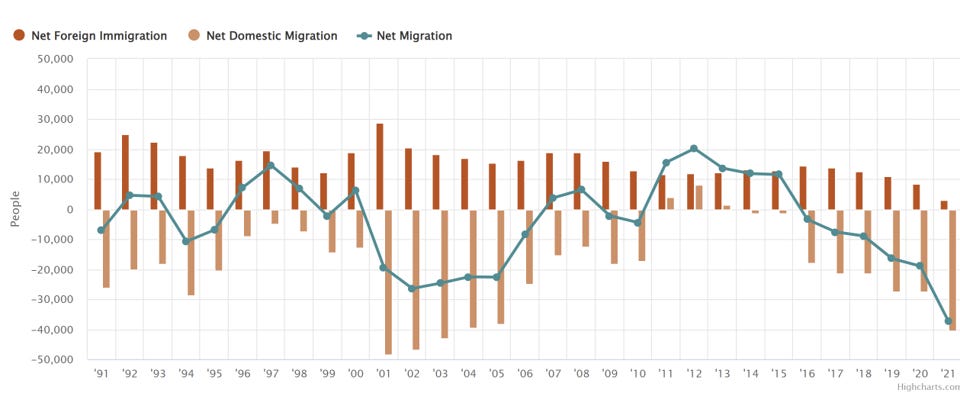
In the case of those that show a net decline, such as New York or San Francisco, pre-pandemic there already was a trend of net outflow of incumbent residents. This was previously offset by an inflow of international migrants. As of today this inflow clearly has not been restored. Data below displays San Mateo and Santa Clara County migration flows from 1991-2021, via Silicon Valley Indicators. I shared these with class on the first day.
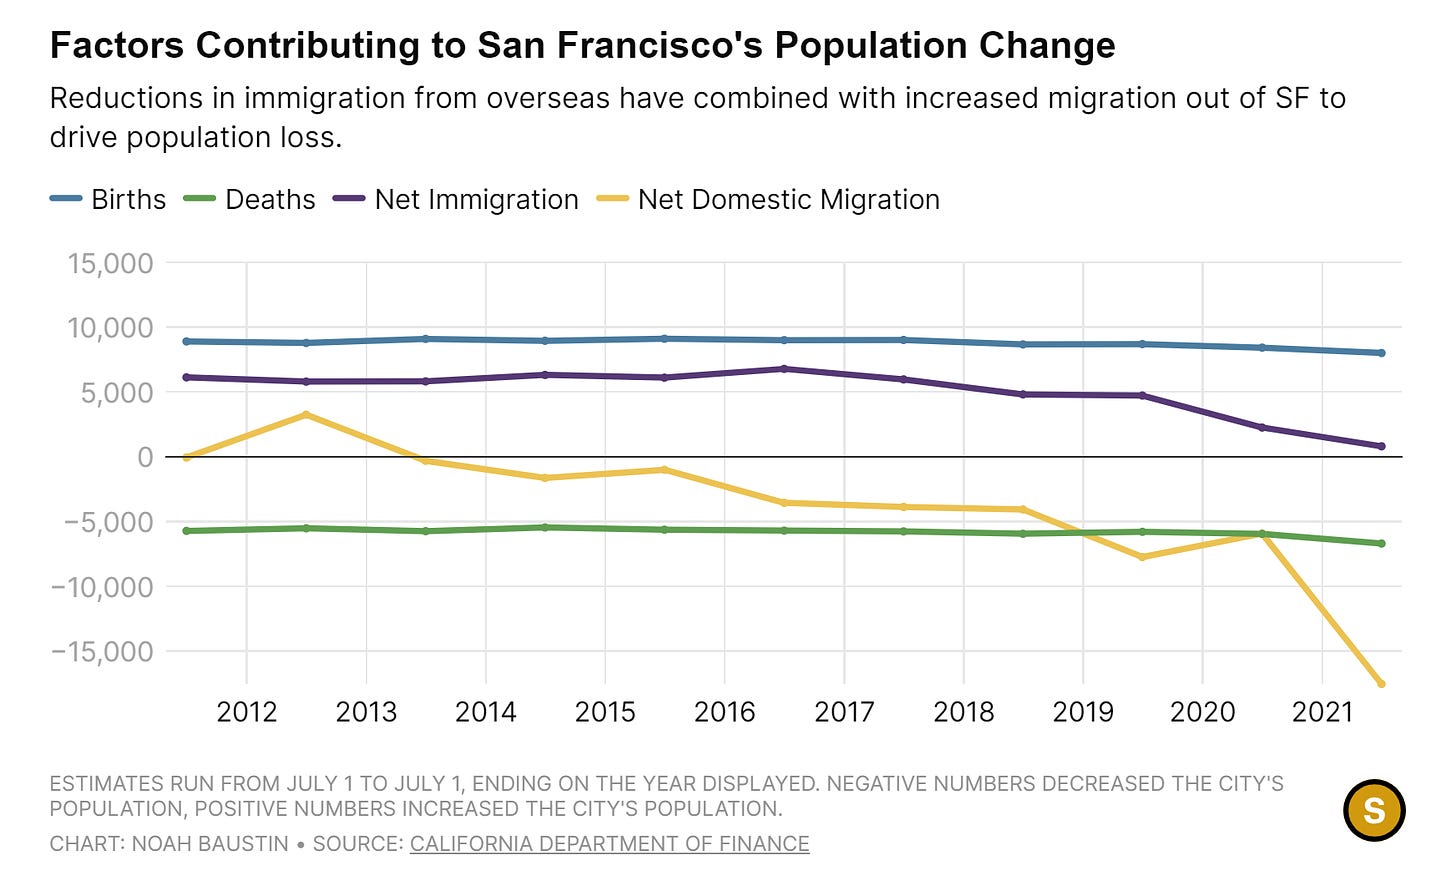
California Department of Finance data, via SF Standard, provides a disaggregated look at the impact of migration combined with a drop in immigration.
This was highlighted in a paper by MBA student Bruno Velloso Rodrigues. The data below is for San Francisco.
But where are they moving to? Students found creative ways to measure.
PODS index; United Van Lines
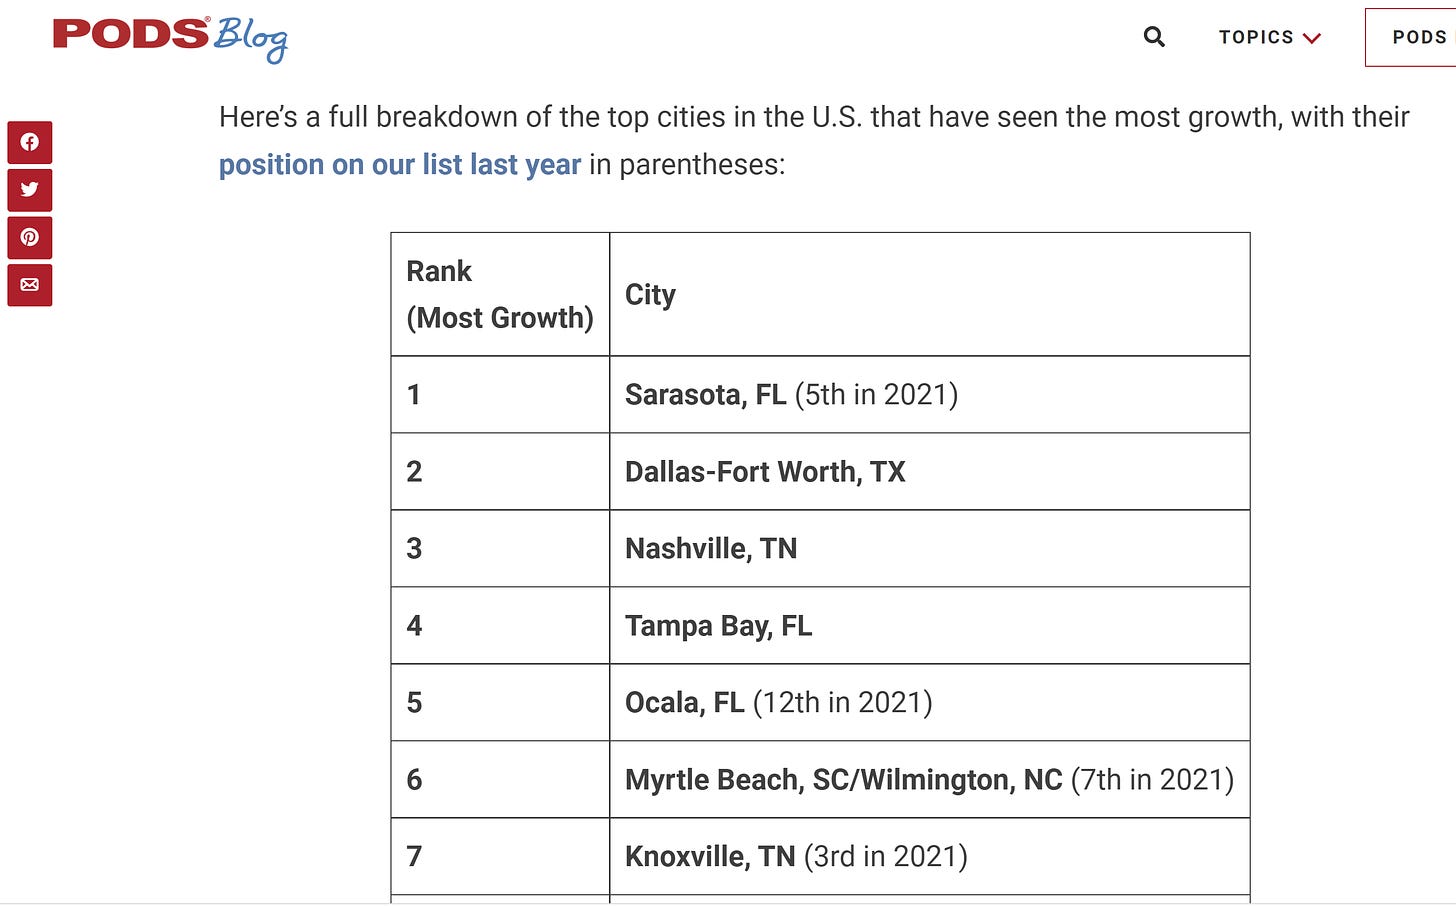
The POD on a pallet is, of course, tried-and-true sign of a pre-move decluttering, potentially followed by a move larger than would fit in a U-Haul. Development Engineering student Riley Jones cited the PODS Index in a look at Dallas-Fort Worth. This data set is from January to March 2022.
Broadly, Americans have moved from Northeast and Midwest, to the South, Southeast and West since 1950. But the PODS list looks like a southeastern sports tournament. Phoenix, our overall winner on USPS address changes, shows up as #10.
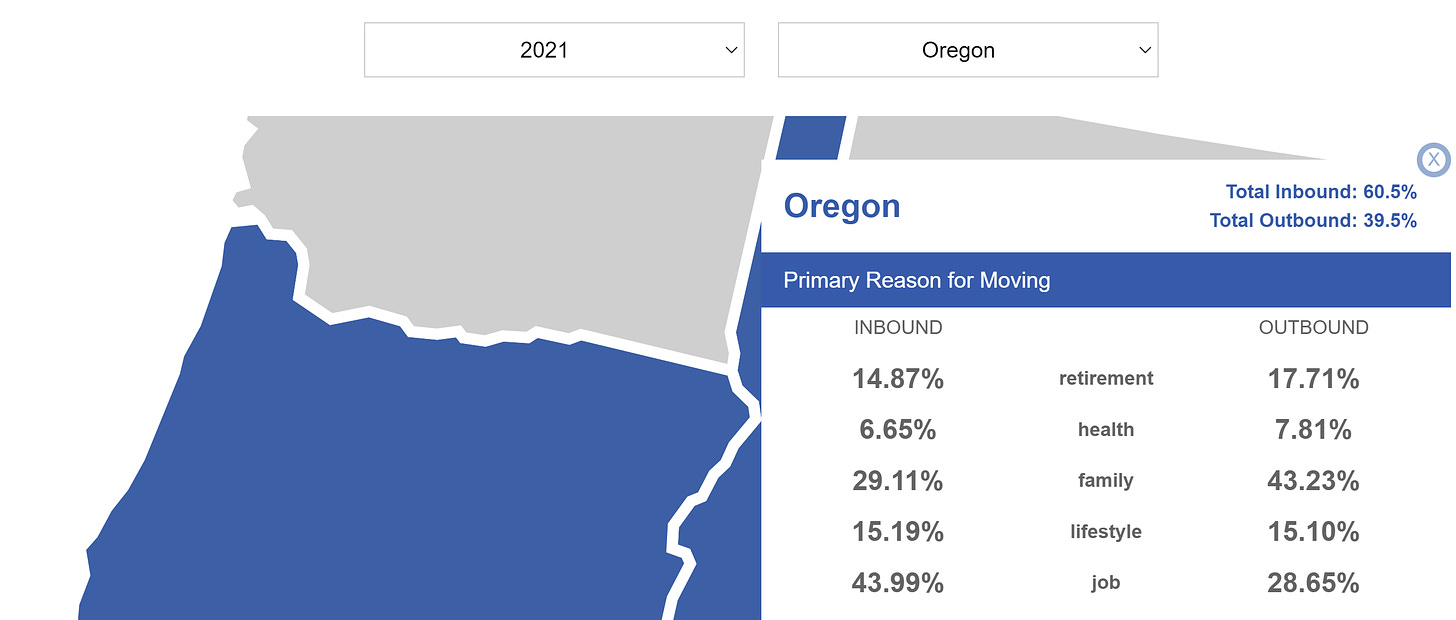
In a similar vein, MBA Henry Gordon looked at United Van Lines data from 2021, in highlighting Oregon as a popular inbound state.
School enrollment
One way to differentiate between opportunistic explorers taking advantage of a unique moment and actual serious household movement - local school enrollment. Like USPS updates, but even more so, this seems to measure serious intent to stay for a while. MBAs Drew Silverman and Sarah Thorson highlighted the increase in local school enrollment in papers looking at Jackson Hole and Bozeman, respectively.
From handsets (always on your person); to paper mail (your household); to stuff too big to fit in a car; to moving trucks; to school enrollments — the metrics vary. Broadly, though, they highlight an amplifying effect - cities that were already growing pre-pandemic accelerated that growth, and as a consequence, started showing signs of stresses, such as congestion, increases in housing prices, and more crowded classrooms. Simultaneously, existing stresses at knowledge work super-cities, such as San Francisco and New York, which already had outflows of incumbent residents, were exacerbated when immigration inflows were stopped and the tether to the city center was weakened.
But lest we pick on San Francisco or New York too much, MBA Austin Long provided a delightful rebuff, based on air travel and consumption data, to those who would say New York’s lights have dimmed, and reminded us that only New Yorkers are allowed to complain about New York.


